This week, Google announced a new feature of Google Maps: a COVID-19 Layer. According to Google, the new layer features a seven-day average of new COVID cases per 100,000 people in the geographic area displayed. The goal of the layer is to allow Google users to travel as safely and efficiently as possible.
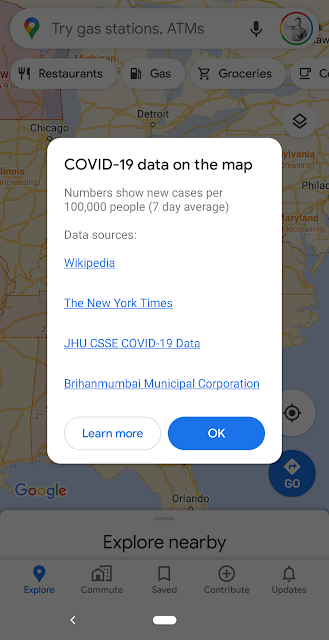
The data, which is sourced from “multiple authoritative sources, including Johns Hopkins, the New York Times, and Wikipedia,” is displayed on the screen as a seven-day average of new COVID-19 cases per 100,000 people.
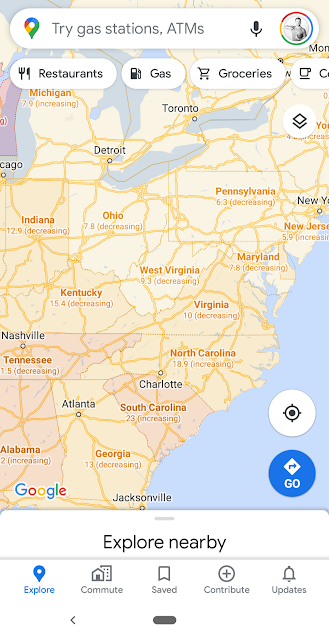
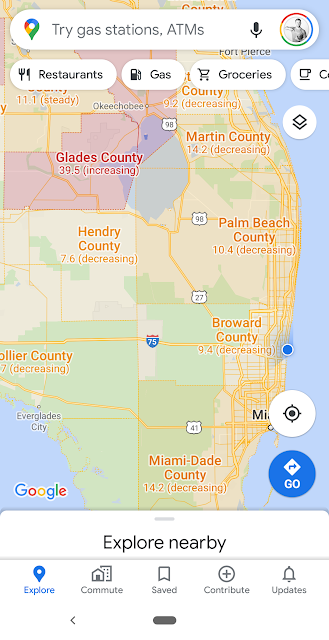
Using a color scale, Google Maps can display the density of cases in any given area based on the information available. Additionally, Google will include a label to indicate whether the cases are trending up or down in the displayed region.
Here’s how it works (from Google’s blog, The Keyword):
- Open the Google Maps app
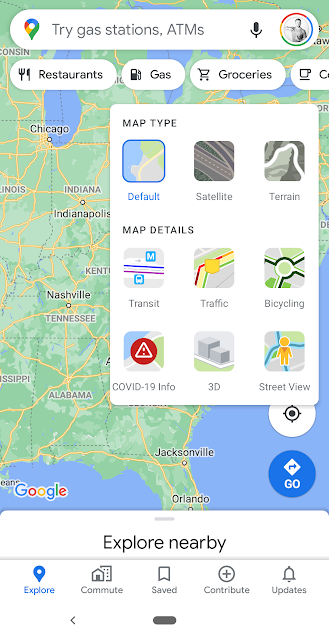
- In the top right corner, tap on the layers icon
- Click on “COVID-19 info” (If you don’t see it yet, hang tight, as this is rolling out)
- See COVID-19 data for your area
The COVID layer starts rolling out worldwide on Android and iOS this week, and is the latest in a series of features like popular times and live busyness, COVID-19 alerts in transit, and COVID checkpoints in driving navigation--all designed to help users navigate the world around them as quickly and safely as possible.